Alert rules can be based on any Logpoint query to check logs for signs of malicious activity or for operational messages and thresholds. Once you create an alert rule, it is automatically shared with the users in the Logpoint Administrator user group.
To create an alert rule:
Go to Settings >> Knowledge Base from the navigation bar and click Alert Rules. Click ADD. Alternatively, you can go to Dashboard or Search Template widget, click the drop down icon. Click Alert. If you are creating an alert rule from a widget, Logpoint automatically adds the widget’s query in the Query field.

Creating alert from widgets
Go to Overview and click Edit on the specific field to edit. Alternatively, you can edit from Parameters, Criteria, Meta-Data, Ownership, and Data Template pages in the right.
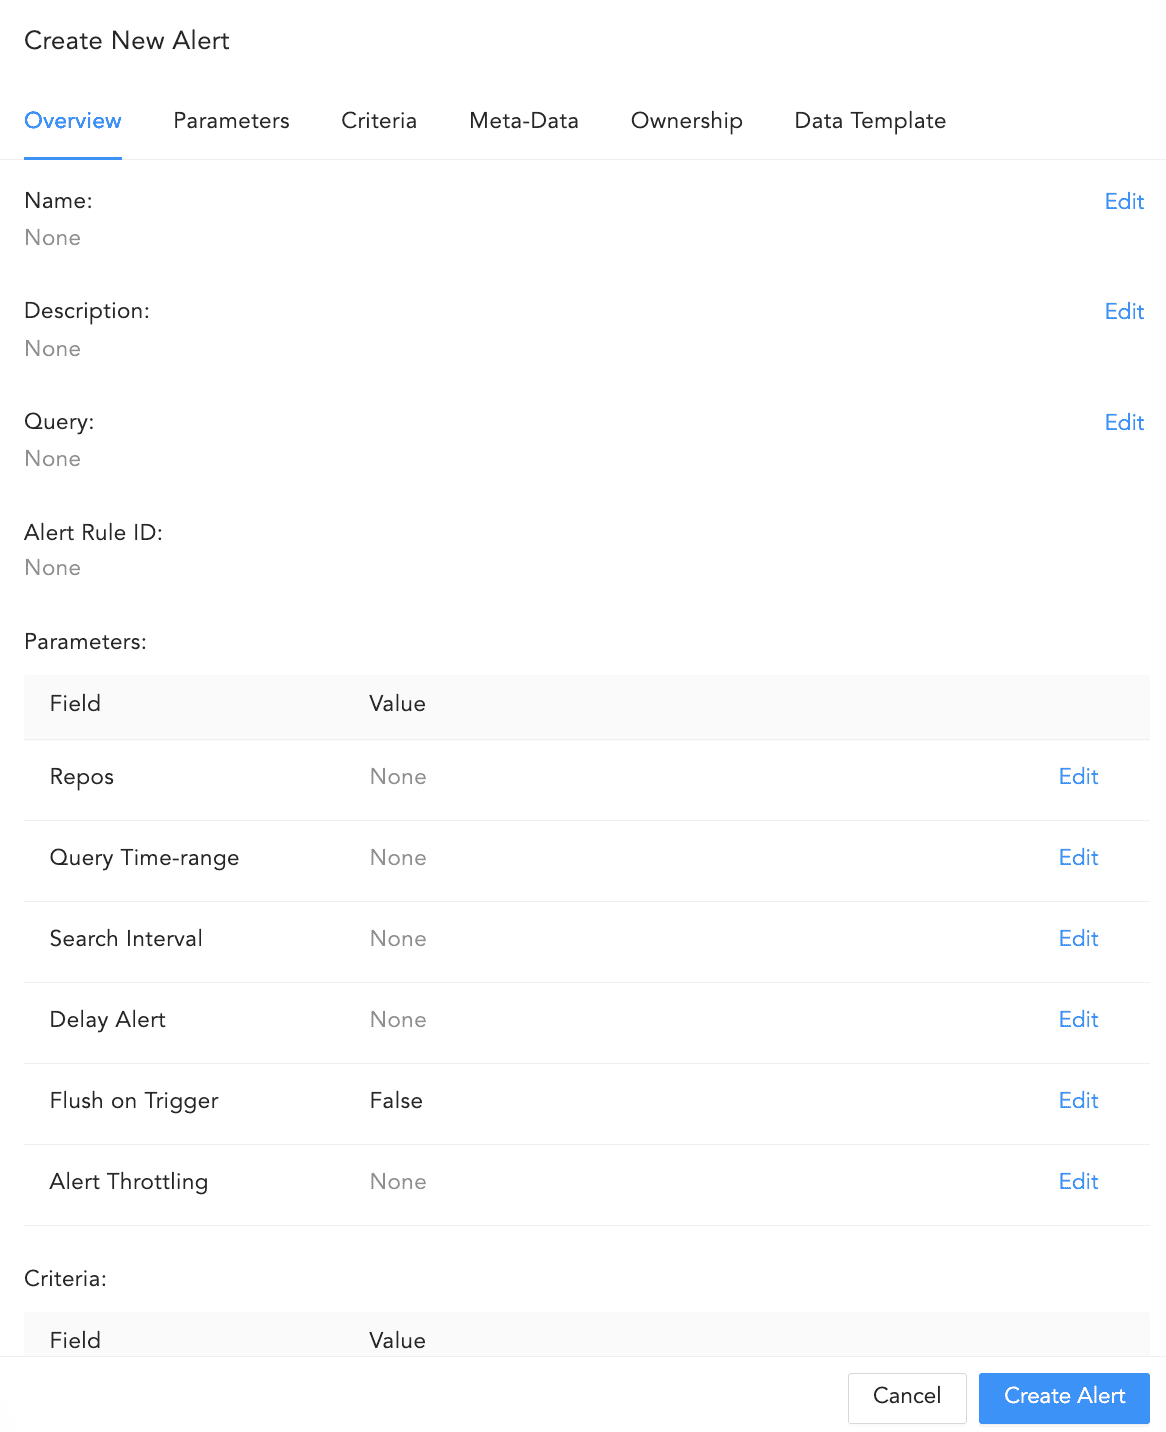
Overview
Enter the Name of the alert.
Enter a Description.
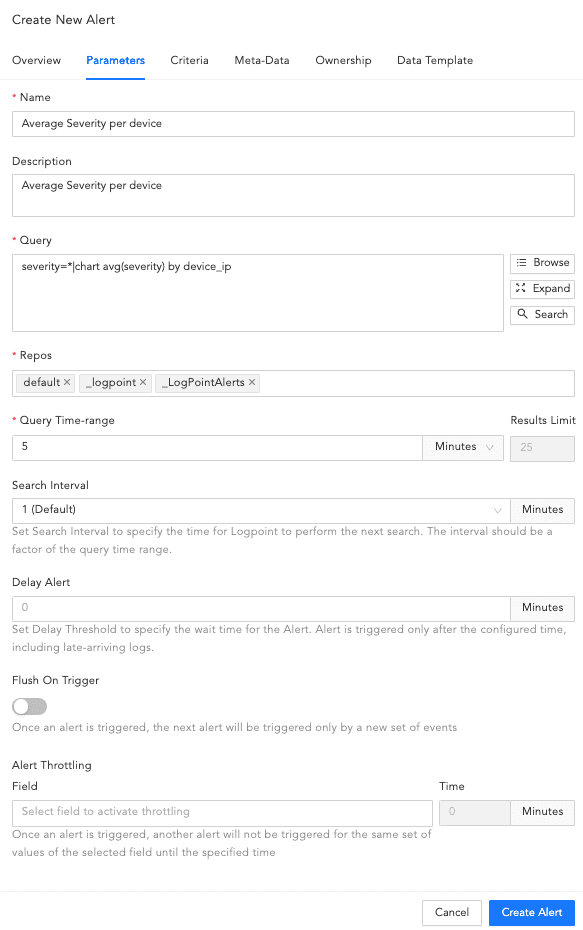
Parameters
In Query, enter an alert query. If Data Privacy is enabled, the values for all the configured Data Privacy Module fields are encrypted. For queries that have specific configured fields values, Logpoint does not generate an incident. However, for the queries that have all their values an incident is generated with encrypted field values. For example, if you have configured the device_name field under the Data Privacy Module, then the query device_name=localhost does not generate any incident. However, the query device_name=* generates the incidents with encrypted values.
Next to the Query field use Browse, Expand, and Search to enter or select a query.
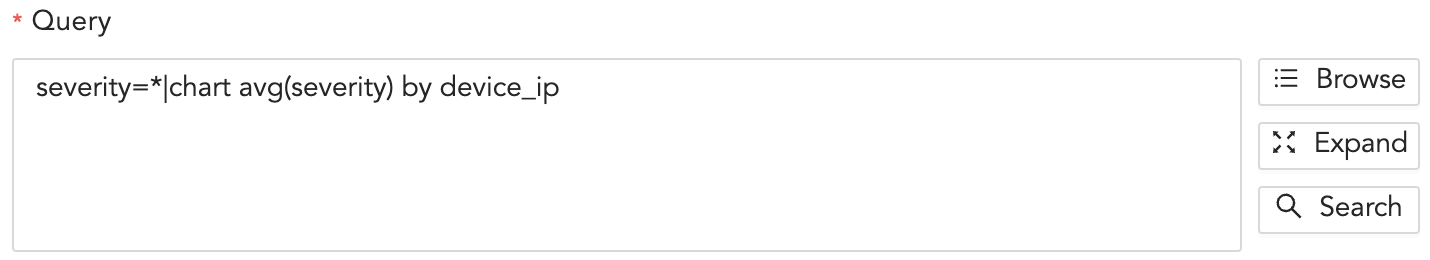
Browse, Expand, and Search
Browse
Clicking Browse takes you to the query picker. It allows you to select a predefined query on which to base the alert rules.
The queries are:
Search History: Lists all the recent search queries executed in Logpoint.
Saved searches: Lists all the queries saved by the user.
Vendor searches: Lists the predefined queries provided by the vendor.
Search Labels: Lists the search labels of Logpoint. Labels are assigned while writing signatures for the logs.
Live Searches: Lists the queries used by other created alerts.
Click Select Query to select the queries from the lists.
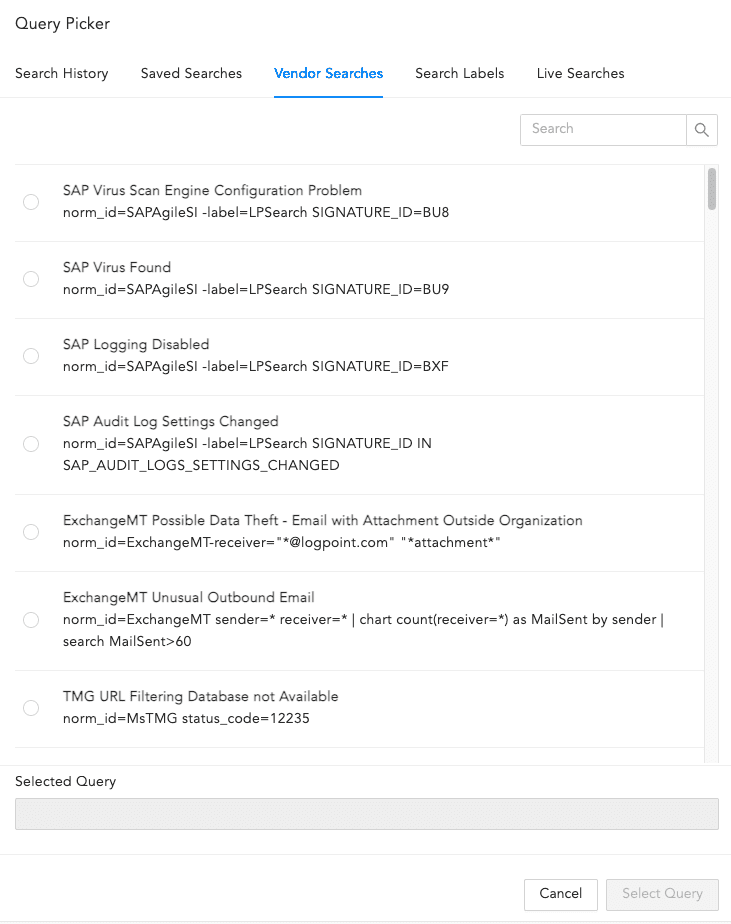
Query Picker
Expand
If your query is long, click Expand. Click Collapse to return to the default view.
You can collapse the expanded field by clicking Collapse.
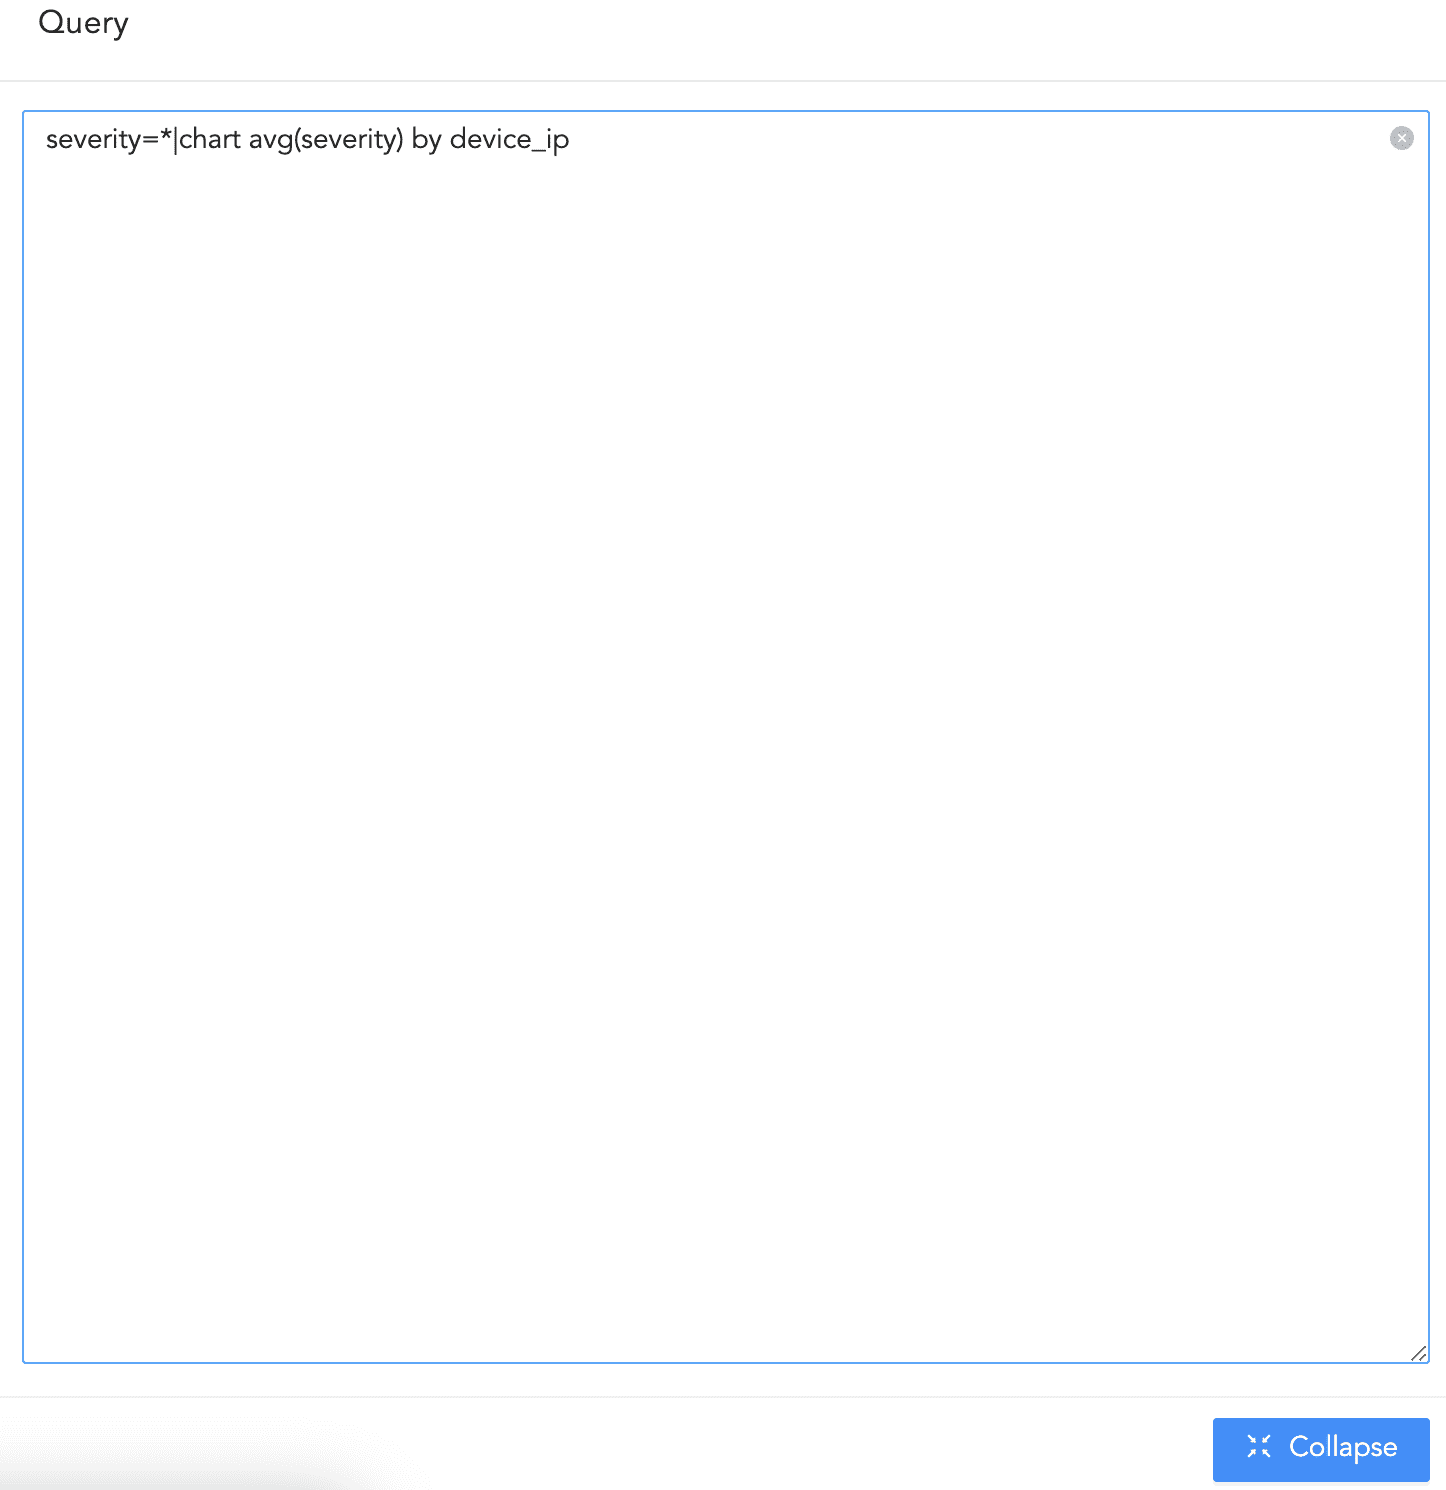
Expanded Query Field
Search
Use it to perform a search using the query you entered. You are redirected to Logpoint search and your query is auto-filled.
Select the Repos to be monitored to match the alert condition. You can also select the repo using Repo Selector by clicking on Advanced Selection.
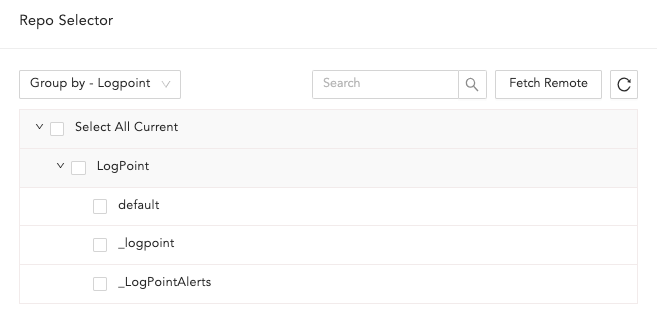
Repo Selector
In Repo Selector, you can fetch all the repos from remote Logpoints by clicking Fetch Remote.
In the Query Time Range, specify the time period Logpoint should search for logs when triggering the alert. For example, if you set it to 3 days, Logpoint will search logs from the past three days. You can define the time range in minutes, hours, or days, up to a maximum of 30 days (or its equivalent in hours and minutes).
In Results Limit, enter the maximum number of logs to retrieve using the Query. It is hidden if you enter an aggregation query in the Query field.
If Data Privacy is enabled, you will see Data Privacy Module: Alert Using Original data. This determines whether the data is encrypted or not. By default they are encrypted. To decrypt them, select Alert Using Original Data.
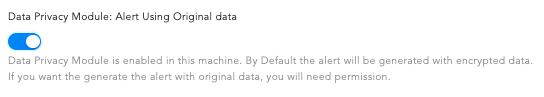
Data Privacy Module
Select the Search Interval in minutes to define how frequently Logpoint should run the query for this alert. For example, if you set it to 30, Logpoint will run the query every thirty minutes. The search interval must be a factor of your query time range, which helps Logpoint perform optimally.
Important
Do not set the search interval to match the query time range, as this results in missing logs, particularly those at the end of the time range.
You can’t apply the search interval to a correlation query.
The search interval can be a maximum of 1440 minutes (24 hours). Even if your query time range has factors greater than this, Logpoint will automatically use the largest factor that doesn’t exceed 1440 minutes. For example, if your query time range is 3 days (4320 minutes), your longest possible search interval will still be 1440 minutes, as it’s the highest factor within the limit.
To ensure all relevant logs are collected before an incident is generated, enter the Delay Alert in minutes. Set this delay based on how long it generally takes for logs to arrive in Logpoint from your device. The delay can be due to source device settings, fetch interval (if fetchers are used), network latency, or other external factors.
To determine the delay for your log source, run the following search command:
| chart avg(index_ts - log_ts) as average_delay_seconds, max(index_ts - log_ts) as max_delay_seconds
This command returns the average and maximum delay in seconds. We recommend using the average delay in seconds as a baseline and setting the Delay Alert slightly higher than this value to ensure late-arriving logs are captured in the incident analysis.
Important
Delay Alert can only be used with log_ts based queries.
The maximum value of the Delay Alert can be up to 24 hours.
Enable Flush On Trigger to ensure the next alert is triggered only based on a new set of events.
Set Alert Throttling to ensure that Logpoint does not create multiple alerts for the same set of values for a specified time. Enter the Field and the time in Minutes. Once an alert is triggered for a value set of the particular Field, it does not trigger another alert with the same set of values until the time specified minutes has passed.
Go to Criteria.
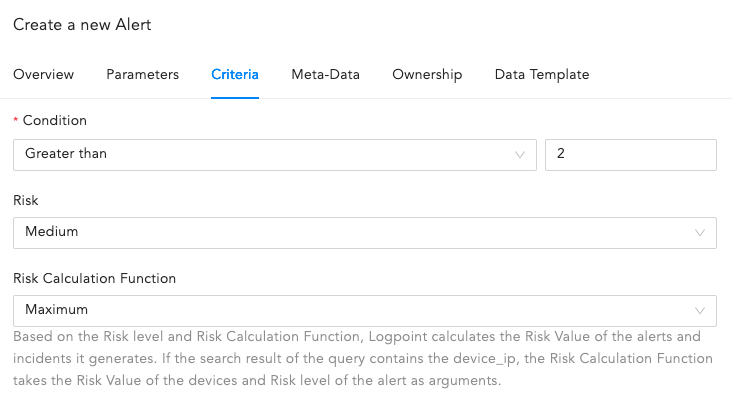
Criteria
Select the Condition, Risk, and Risk Calculating Function from the dropdowns.
Based on the Risk level and Risk Calculation Function, Logpoint calculates the Risk Value of the alerts and incidents they generated. If the search result of the query contains the device_ip, the Risk Calculation Function takes the Risk Value of the devices and Risk level of the alert as arguments.
For example:
If the Risk level of an alert is Medium, Risk Calculation Function is Maximum, and the Risk Value of its associated device(s) is Critical, the Risk Value of the generated alert and incident is: Maximum(Risk level, Risk value of device(s)). That means the Risk value of the incident is Critical.
The risk value of a device is calculated from the values of Confidentiality, Availability, and Integrity.
Whereas for search queries with pipeline commands or without device_ip in the search results, the Risk Value of the alert and its generated incident(s) is equal to the Risk level of the alert.
Condition is the number of logs the search will return. Setting a limit controls the number of logs for the search. The number of logs you select should not exceed the previously set limit. Logpoint compares the limit value to the value set in the condition to the added alert rule. For example, if you set the limit to 30 logs, your condition must be 30 or less.
Average returns the average of the sum of Confidentiality, Availability, Integrity, and Risk divided by the number of times they happened. Maximum returns the highest value and Minimum returns the lowest.
Go to Meta-Data.
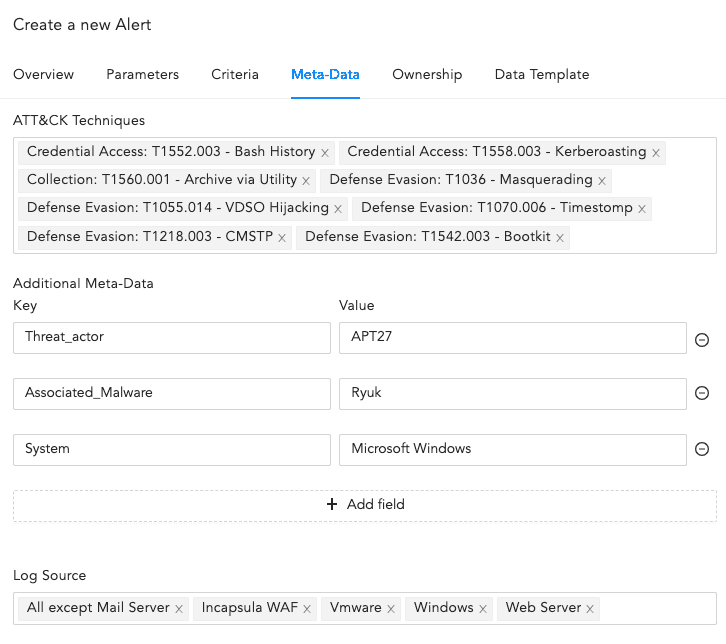
Meta-Data
Select the ATT&CK Techniques from the dropdown. You can select multiple techniques to categorize the alert.
Enter Additional Meta-Data as Field and Value to categorize the alert rules. You can add new fields and values by clicking Add Field. The Metadata Field should contain letters or a combination of letters, numbers, or underscores (_), and must start with a letter.
Warning
You cannot enter Logpoint reserved Jinja placeholders as Metadata field in the Field column. Go to Logpoint Reserved Jinja Placeholders to view the list of publicly available Logpoint reserved Jinja placeholders.
You cannot repeat the Metadata Field.
Value associated with the Metadata Field cannot be empty and vice-versa.
Select Log Source from the dropdown or add new log sources associated with the alert rule.
Go to Ownership. If Data Privacy Module is enabled, users with the Can Grant Access permission can grant access to alerts to users with the Can Request Access permission. If you are a user who can grant access, you can view the requests from Settings >> Configurations >> Data Privacy Module >> Pending Request.
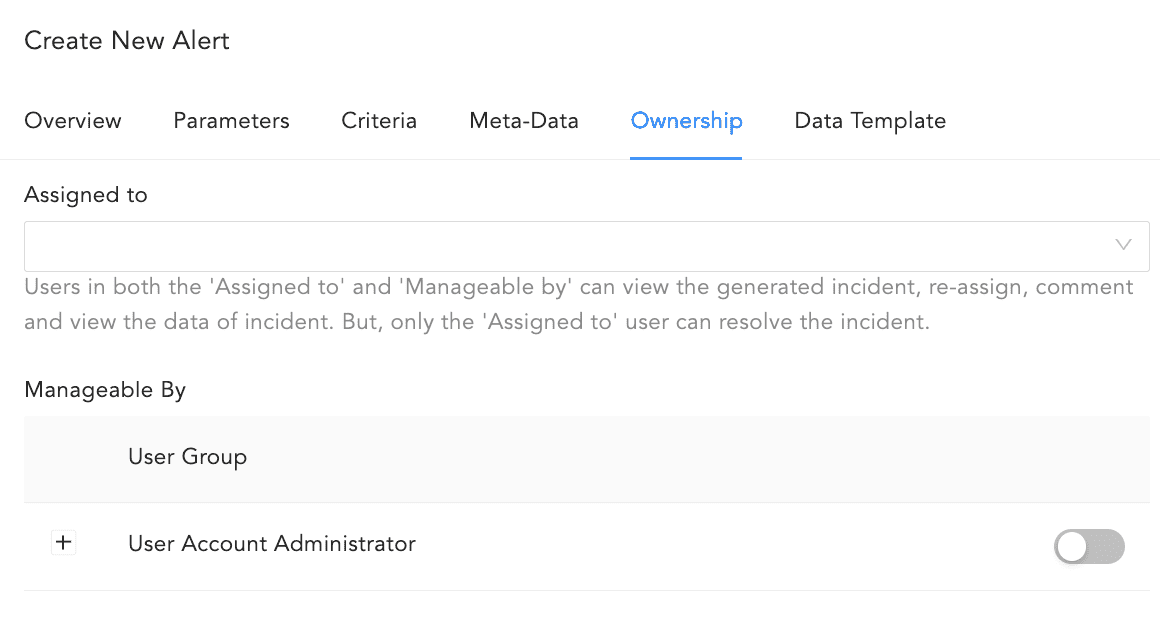
Ownership
If you are a user who requested access to an alert, you can view the status of your requests from Settings >> Configurations >> Data Privacy Module >> My Request.
You need to assign the Alert rule to a user, user group or yourself. Assigned users can re-assign, comment on, and view the data of the generated incident. They can also resolve the alert.
Alert Rules can be exported and imported. If you export an Alert Rule, the ownership is lost. If you import an Alert Rule, you get the ownership.
To assign the alert to
An individual user, use the Assigned to dropdown to select them.
A group, use the Manageable By to select them.
To yourself, deselect all of the Incident User Groups in Manageable By.
If you do not belong to any Incident User Groups, both the Assigned to and Manageable by are hidden and you get the following:
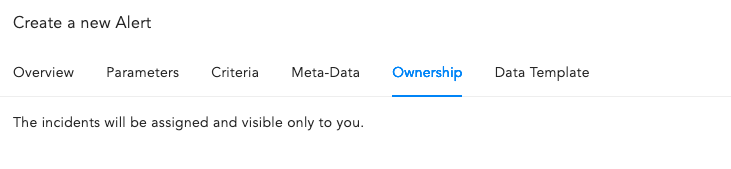
Ownership when you don’t belong to an incident group
Go to Data Template.
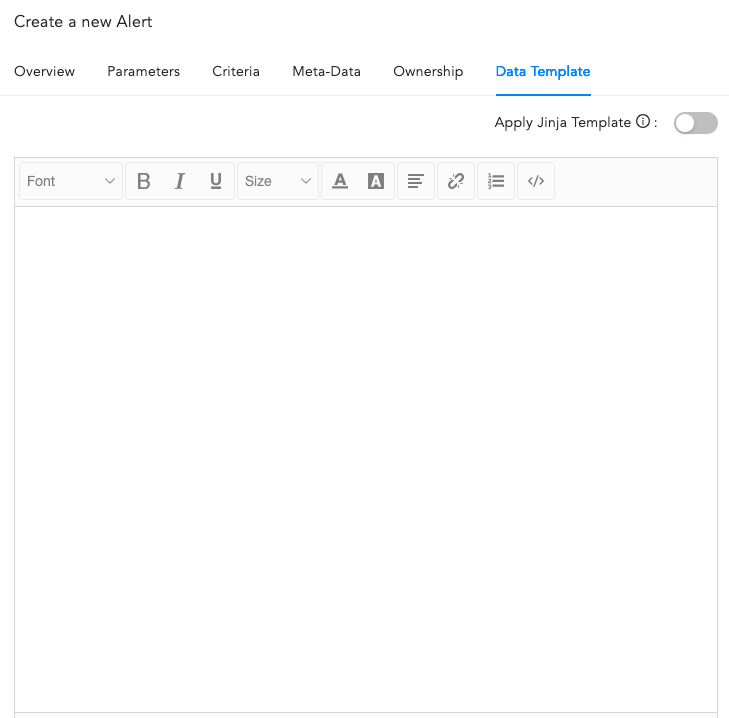
Data Template
Enable Apply Jinja Template and enter the template code in the text field. The template will not appear in a formatted manner, but this will not impact its functionality. Logpoint allows you to view the details of the incidents triggering the alert in a format specified in the Jinja template.
Important
When using a Jinja template that includes a timestamp, applying the datetime filter is mandatory to ensure the timestamp remains in its raw epoch format and the date is clearly displayed.
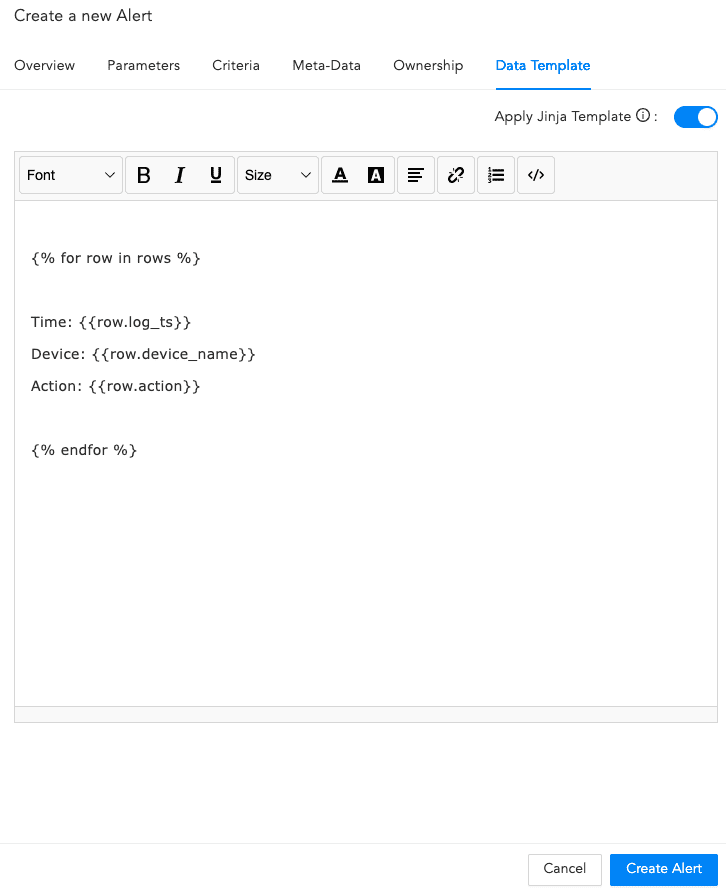
Jinja Syntax
Click Create Alert.
When the alert is successfully created, you will get a confirmation message.
Alert is Successfully Created
After configuring the Alert Rule, Logpoint automatically notifies you when an alert is triggered. Go to Setting Up Alert Notifications to learn how to set up alert notifications.
An alert is triggered and an incident for the alert is generated every time the search query meets all the alerting criteria.
To view all incidents, go to the Navigation bar and click Incidents.