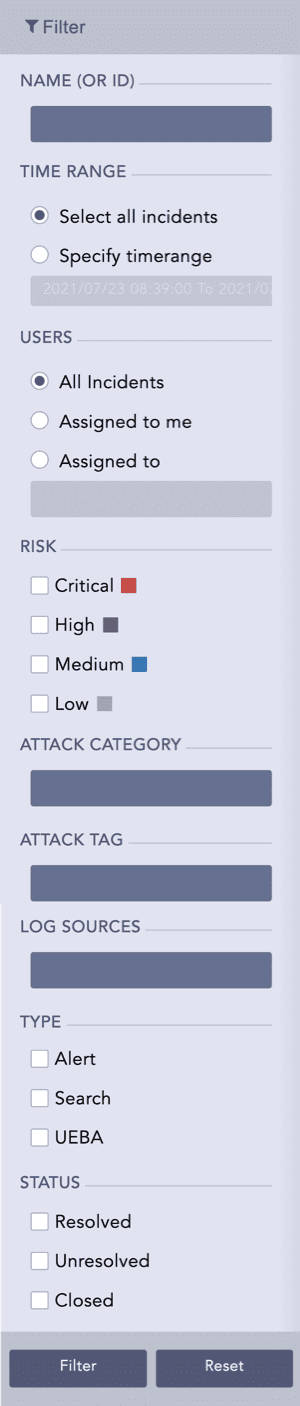
The devices may trigger multiple incidents which would make searching for a particular incident complicated. To narrow down the search for a particular incident, you can use various filters such as Name (OR ID), TimeRange, Users, Risk, Attack Category, Attack Tag, Log Sources, Type, and Status. You can access the Incident page and its filter under Investigation >> Incidents from the navigation bar.
Filters in Incident
You can directly search for a particular incident by specifying its name or its Incident ID. You can also search for all the incidents associated with an alert using the AlertRule ID. You can obtain the Incident ID and AlertRule ID by clicking the Incident Data option on the Incident page. You can also use the following filters to search for specified incidents.
TimeRange: to view the incidents generated at a particular time.
Users: to view the incidents assigned to you or any other users.
When you select the All Incidents option, the incidents created by, assigned to and manageable by the current user (the user who has logged in) are listed.
Risk: to view the incidents of a particular severity level (critical, high, medium, low).
Attack Category: to view the incidents according to the attack categories associated. You can select multiple attack categories from the drop-down.
Attack Tag: to view the incidents according to the attack tags associated. You can select multiple attack tags from the drop-down.
Log Sources: to view the incidents according to the log sources associated. You can select multiple log sources from the drop-down.
Type: to view the incidents by the source (Alert, Search, UEBA) that generated them.
Status: to view the incidents according to their status (resolved, unresolved, closed).