Certain devices send logs to dedicated ports. Collectors listen to dedicated ports and collect logs. These logs are then processed and transferred to a Logpoint for storage. For devices that can not send logs, you can use Built-in Fetchers to retrieve logs from them.
Logpoint has the following collectors:
Go to Integrations for more details on additional collectors and fetchers supported by Logpoint.
Syslog Collector collects logs from devices and log sources that follow the Syslog protocol.
You can use Syslog Collector in one of two ways:
It collects syslog messages from the source devices, processes the logs, and forwards them to Logpoint. It facilitates direct communication between source devices and Logpoint.
It collects syslog messages from the source device and sends them to Logpoint, acting as a proxy between the source device and Logpoint. It is configured where direct communication between source devices and Logpoint is not possible, such as when there are network restrictions, location restrictions, or security policies in place.
Configuring Syslog Collector in Logpoint
Go to Settings >> Configuration from the navigation bar and click Devices.
Click the Add collectors/fetchers ( ) icon next to the device.
Click Syslog Collector.
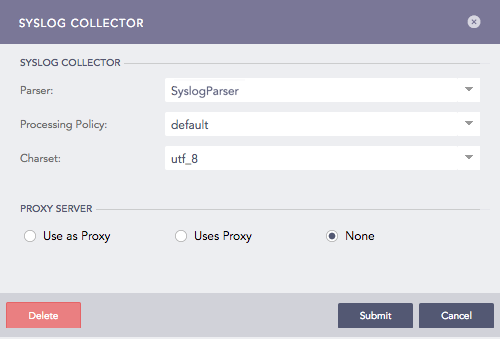
Syslog Collector
Select a Parser, a Processing Policy, and a Charset. If you use Syslog Collector as Proxy, you can’t select Processing Policy. If your Syslog Collector uses proxy, you can’t select Parser and Charset.
In Proxy Server, select
None for the device to work as a Syslog Collector.
Use as Proxy to use the device as a proxy.
If a device not configured as a Proxy sends logs via a syslog proxy device, it is considered malicious, and its events are rejected.
Uses Proxy to collect logs collected through a proxy server. Select the Proxy IP and enter the HostName of the source device, which is case-sensitive.
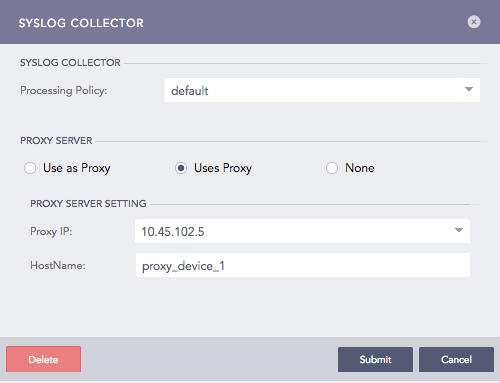
Syslog Collector (Uses Proxy)
A proxy sever can have multiple source devices but each device’s hostname must be unique.
Click Submit.
Syslog Collector supports the RFC 6587 specification for UTF-8 encoded logs with the following formats:
RFC 3164
Standard RFC 3164:
<PRI> MTH DD HH:MM:SS Hostname LogContent
For example:
<12> Aug 12 13:14:59 HostName1 This is test1RFC 3164 with year:
<PRI> YYYY MTH DD HH:MM:SS Hostname LogContent
For example:
<13> 2015 Apr 8 05:28:13 HostNameA [warning] 1: #1192 Invalid IP resolution
2015 Apr 8 05:28:13 HostNameA [warning] 1: #1192 Invalid IP resolution
RFC 5424
<PRI> [PRIVAL] [FULL-DATE]T[FULL-TIME] Log Content
Here,
FULL-DATE = DATE-FULLYEAR “-” DATE-MONTH “-” DATE-MDAY
FULL-TIME = PARTIAL-TIME TIME-OFFSET
PARTIAL-TIME = TIME-HOUR “:” TIME-MINUTE “:” TIME-SECOND [TIME-SECFRAC]
TIME-SECFRAC = “.” 1*6DIGIT
IME-OFFSET = Z / (“+” / “-“) TIME-HOUR “:” TIME-MINUTE
For example:
<165>1 2018-09-14T09:15:15.000003-07:00 Off set value -7
<165>1 2018-09-14T09:15:15.000003-11:00 Off set value -11
Logpoint prioritizes the timezone offset in the log over the device’s timezone when extracting log_ts. If both the device and the log contain timezone information, the log’s timezone offset is used for log_ts.
Before you start receiving logs, you need to configure the settings on the log source. To configure your Linux or Windows machines to forward logs to Logpoint:
Configuration for Linux devices
Open the syslog configuration.
/etc/syslog.conf
Add your remote server in this format.
*.*     @logserv.example.com:port


Example:-

*.*     @192.168.2.205:514
Restart Syslog.
Configuring Linux devices for forwarding SSL encrypted log message
Install stunnel, and type the following command in the terminal.
sudo apt-get install stunnel
Copy /usr/share/doc/stunnel4/examples/stunnel.conf-sample to /etc/stunnel/stunnel.conf.
Go to /etc/stunnel/stunnel.conf and modify as follows (create it if doesn’t exist).
client=yes
Now, on the same config file add:
[sslsyslog]
accept  = 127.0.0.1:60515
connect = 192.168.2.200:515
Restart the config file with:
stunnel4/etc/stunnel/stunnel.conf
Open /etc/syslog.conf with the administrative privilege.
Forward the logs to Logpoint server.
*.* @@127.0.0.1:60515
Restart syslogd with:
service rsyslog restart
Go to Logpoint server.
Select the Linux Device from Settings >> Configuration >> Devices and click Add Collectors/Fetchers.
Configuration for Windows devices
You can forward syslog format logs from Windows devices to Logpoint using third-party agents. We recommended InterSect alliance’s Snare for Windows. The following procedure only applies to Snare for Windows.
Go to Network Configuration in Snare.
Enter the IP address of your Logpoint in Destination Snare Server Address.
Enter port number 514 in the Destination Port.
Click Change Configuration.
Go to Apply the Latest Audit Configuration and click Reload Settings.
Sequence Numbering in logs collected from Syslog Collector
A sequence number is assigned per device per protocol to each log collected from the Syslog Collector. This helps you identify the order of the logs received from a particular device.
The log collected from a device with the device IP 192.168.0.135 and communicating via the TCP protocol is:

Sequence Number for TCP Log
The sequence number for the above log is 41, which is shown as the field value for seq_num_tcp. It means that this log is the 41st TCP log message received from the device with the device ip 192.168.0.135.
Similarly, the log collected from a device with the device ip 192.168.0.135 and communicating via the UDP protocol is as follows:

Sequence Number for UDP Log
The sequence number for the above log is 83, which is shown as the field value for seq_num_udp. It means that this log is the 83rd UDP log message received from the device with the device ip 192.168.0.135.
And, the log collected from a device with the device ip 192.168.0.135 and communicating via the SSL protocol is as follows:

Sequence Number for SSL Log
The sequence number for the above log is 68, which is shown as the field value for seq_num_ssl. It means that this log is the 68th SSL log message received from the device with the device ip 192.168.0.135.
Configuring Sequence Numbering
When you configure or add sequence numbers to logs, each log is assigned an incremental number starting from 1. Sequence numbering resets when you restart Syslog and when the number of logs reaches 1,000,000,000,000.
Go to Settings >> System Settings from the navigation bar and click System Settings.
Go to General tab, scroll until you find Sequence Numbering.
Select Add sequence numbers on log received from syslog collector.
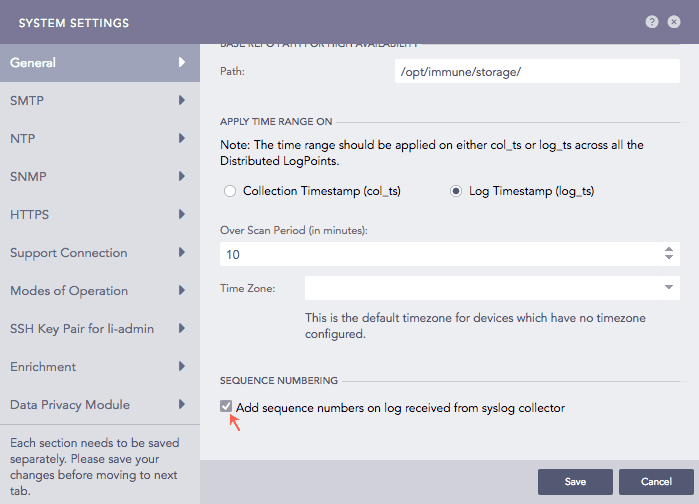
Configuring Sequence Numbering for logs collected from Syslog Collector
Click Save.
Snare Collector collects and analyzes logs from the Windows Snare agent.
Configuring Snare Collector in Logpoint
Go to Settings >> Configuration from the navigation bar and click Devices.
Click the Add collectors/fetchers icon under Actions.
Click Snare Collector.
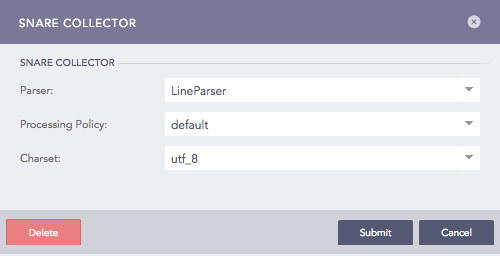
Configuring Snare Collector
Select a Parser, a Processing Policy, and a Charset from the dropdowns.
Click Submit.
Configuration for Windows devices
You can forward syslog format logs from Windows devices to Logpoint using third-party agents. We recommend InterSect Alliance’s Snare for Windows.
To configure Snare for Windows:
Go to the Network Configuration tab in the Snare.
Enter the IP address of your Logpoint in Destination Snare Server Address.
Enter port number 6161 in the Destination Port.
Click Change Configuration.
Go to Apply the Latest Audit Configuration and click Reload Settings.
FTP Collector collects logs from the files uploaded by users using FTP clients. You can add multiple FTP collectors for a single device. You can use any FTP client to forward logs to the FTP collector. We recommend FTP Rush or Filezilla.
Configuring FTP Collector in Logpoint
Go to Settings >> Configuration from the navigation bar and click Devices.
Click Add collectors/fetchers icon under Actions.
Click FTP Collector to see a list of all the FTP Collectors configured for the device.
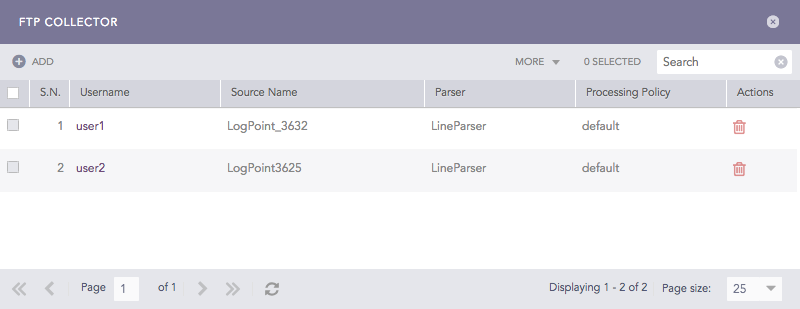
FTP Collectors
Click Add.
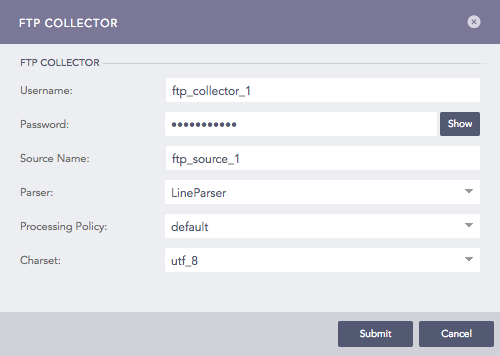
Configuring FTP Collector in Logpoint
Enter a Username and a Password. These credentials are needed to configure settings on the client’s side.
Enter a Source Name. This is the unique identifier for the collector.
Select a Parser, a Processing Policy, and a Charset to apply over the logs.
Click Submit.
Configuring FTP Collector in FTP Clients
To configure FTP Rush or Filezilla:
Enter the address of Logpoint in Host.
Enter the Username and the Password of the FTP Collector.
Use Port 21.
Click Enter or Quick Connect to connect to the Logpoint.
Drag the log files from the Local site and drop it in the Remote site. The files are now transferred to Logpoint.
SNMP Trap Collector collects logs from SNMP enabled devices. SNMP traps are alert messages that devices use to notify the SNMP managerthat there are significant events.
Configuring SNMP Trap Collector in Logpoint
Go to Settings >> Configuration from the navigation bar and click Devices.
Click the Add collectors/fetchers icon under Actions.
Click SNMP Trap Collector.
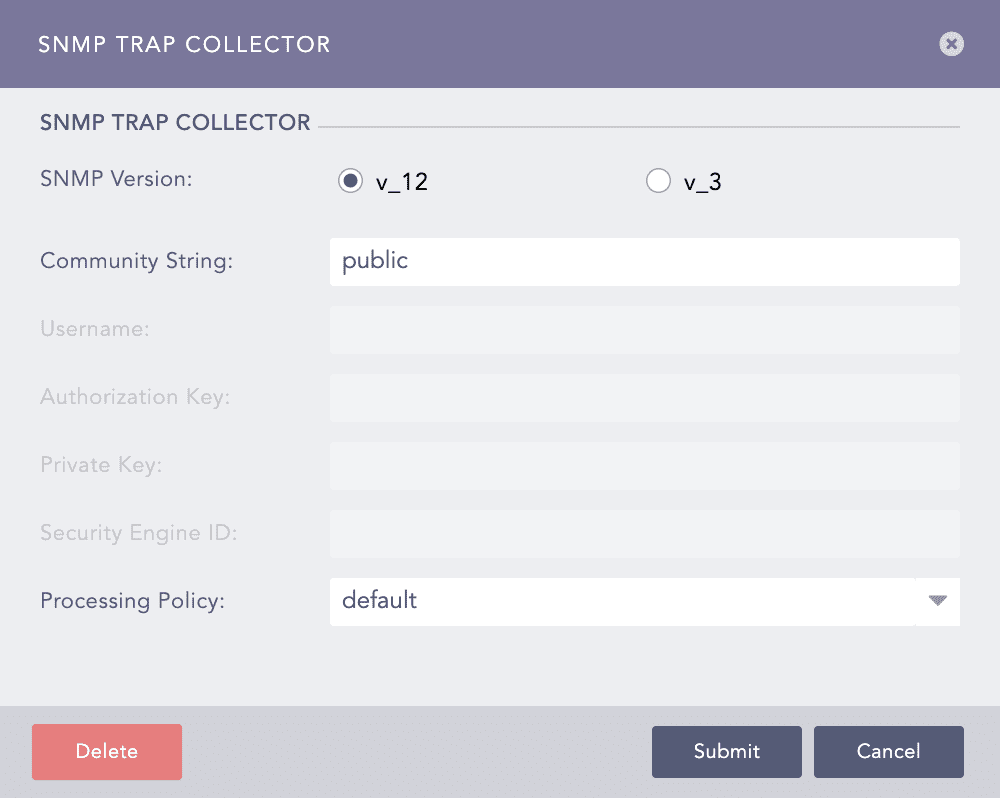
Configuring SNMP Trap Collector in Logpoint
Choose an SNMP Version.
For v_12, enter the Community String.
For v_3, enter a Username, Authorization Key, Security Engine ID, and Private Key. The Authorization Key must contain at least 8 characters.
Select a Processing Policy to apply over the logs.
Click Submit.
Configuring SNMP for Windows
Install Simple Network Management Protocol (SNMP) from Turn Windows feature on or off in the Control Panel.
Run services.msc command.
Search for the SNMP Service. Right click on it and select Properties.
Select TRAPS tab.
Add Community name and Trap destinations.
Click OK.
To manually forward different SNMP traps:
7.1. Run evntwin command and select custom.
7.2. Click Edit and add the event sources.
7.3. Click OK.
sFlow monitors networks, wireless and host devices. Logpoint sFlow Collector forwards counter samples and flow samples using UDP or ARP protocol to Logpoint. Make sure sFlow Package is already installed. The default port number for sFlow protocol is 6343.
Configuring sFlow Collector in Logpoint
Go to Settings >> Configuration from the navigation bar and click Devices.
Click the Add collectors/fetchers icon under Actions.
Click sFlow Collector.
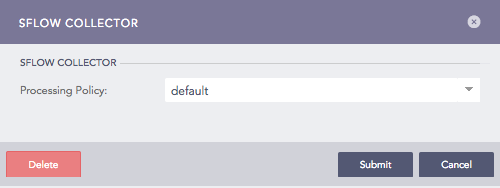
Configuring sFlow Collector in Logpoint
Select a Processing Policy to apply over the logs.
Click Submit.
Starting from Logpoint v6.12.0, the following fields have been renamed according to the Logpoint taxonomy for the sFlow Collector:
Previously Used Field Name |
New Field Name |
|---|---|
agent_ip_address |
host_address |
cs_ethernet_dot3_stats_AlignmentErrors |
alignment_error |
cs_ethernet_dot3_stats_CarrierSenseErrors |
carrier_sense_error |
cs_ethernet_dot3_stats_DeferredTransmissions |
deferred_transmission |
cs_ethernet_dot3_stats_ExcessiveCollisions |
excessive_collision |
cs_ethernet_dot3_stats_FCSErrors |
fcs_error |
cs_ethernet_dot3_stats_FrameTooLongs |
frame_too_long |
cs_ethernet_dot3_stats_InternalMacReceiveErrors |
mac_receive_error |
cs_ethernet_dot3_stats_InternalMacTransmitErrors |
mac_transmit_error |
cs_ethernet_dot3_stats_LateCollisions |
late_collision |
cs_ethernet_dot3_stats_MultipleCollisionFrames |
multiple_collision_frame |
cs_ethernet_dot3_stats_SingleCollisionFrames |
single_collision_frame |
cs_ethernet_dot3_stats_SQETestErrors |
sqe_test_error |
cs_ethernet_dot3_stats_SymbolErrors |
symbol_error |
cs_generic_if_direction |
direction |
cs_generic_if_if_status |
status_code |
cs_generic_if_in_bcast_pkts |
in_broadcast_packet |
cs_generic_if_in_discards |
in_discard |
cs_generic_if_in_errors |
in_error |
cs_generic_if_in_mcast_pkts |
in_multicast_packet |
cs_generic_if_in_octets |
in_octet |
cs_generic_if_in_ucast_pkts |
in_unicast_packet |
cs_generic_if_in_unknown_proto |
in_unknown_protocol |
cs_generic_if_index |
if_index |
cs_generic_if_out_bcast_pkts |
out_broadcast_packet |
cs_generic_if_out_discards |
out_discard |
cs_generic_if_out_errors |
out_error |
cs_generic_if_out_mcast_pkts |
out_multicast_packet |
cs_generic_if_out_octets |
out_octet |
cs_generic_if_out_ucast_pkts |
out_unicast_packet |
cs_generic_if_promisc |
if_promiscuous |
cs_generic_if_speed |
if_speed |
cs_generic_if_type |
if_type |
fs_input_if_format |
input_if_format |
fs_input_if_value |
input_if_value |
fs_output_if_format |
output_if_format |
fs_output_if_value |
output_if_value |
fs_rph_frame_length |
frame_length |
fs_rph_header_protocol |
header_protocol |
fs_rph_header_size |
header_size |
fs_rph_sample_dst_ip |
destination_address |
fs_rph_sample_dst_mac |
destination_hardware_address |
fs_rph_sample_dst_port |
destination_port |
fs_rph_sample_eth_type |
ethernet_type |
fs_rph_sample_ip4_flags |
ip4_flag |
fs_rph_sample_ip_version |
ip_version |
fs_rph_sample_protocol |
protocol |
fs_rph_sample_sender_ip_address |
source_address |
fs_rph_sample_sender_mac_address |
sender_hardware_address |
fs_rph_sample_src_ip |
source_address |
fs_rph_sample_src_mac |
source_hardware_address |
fs_rph_sample_src_port |
source_port |
fs_rph_sample_target_ip_address |
destination_address |
fs_rph_sample_target_mac_address |
target_hardware_address |
fs_rph_sample_tcp_flags |
tcp_flag |
fs_rph_sample_vlan_id |
network_id |
fs_rph_stripped |
rph_stripped |
fs_sample_pool |
sample_pool |
fs_sampling_rate |
sampling_rate |
fs_sequence_number |
sequence_number |
fs_source_id_index |
source_id_index |
fs_source_id_type |
source_id_type |
switch_uptime |
duration |
File System Collector collects logs from Logpoint file systems, allowing you to monitor file access, changes, and other activities. It is only applied to the localhost device. The File System collector processes all the internal logs generated in Logpoint. It captures all the logs from collectors, web servers, mergers, normalizers, services and integrations in Logpoint.
File System Collector can only access logs for files present in /var/log/ and /opt/immune/var/log. If you need to add any file path outside these two locations, contact support.
Configuring File System Collector in Logpoint
Go to Settings >> Configuration from the navigation bar and click Devices.
Click the Add collectors/fetchers icon under Actions.
Click File System Collector.
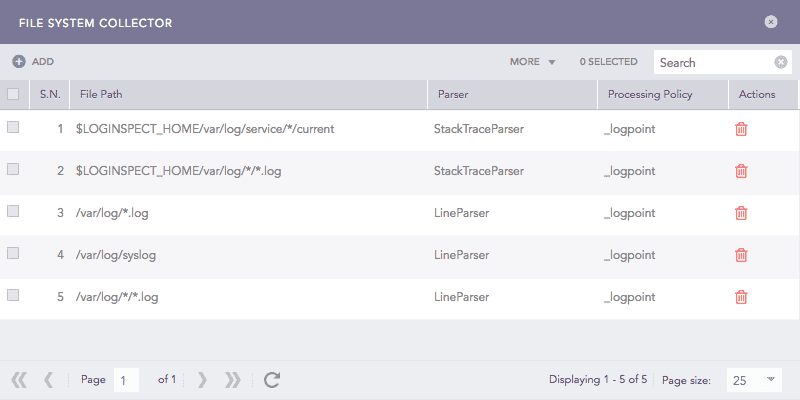
File System Collectors
Click ADD.
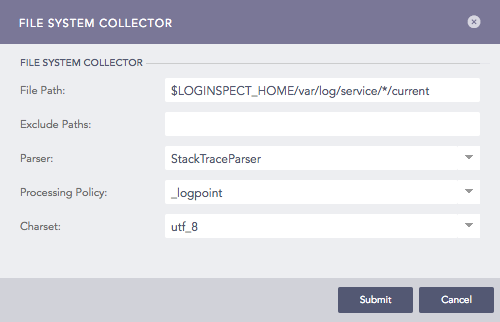
Configuring File System Collector in Logpoint
Enter File Path and Exclude Paths.
Select a Parser, a Processing Policy, and a Charset.
Click Submit.