Aggregators are used with chart and timechart to aggregate fields. The search results can be formatted using fields, chart, or timechart commands.
An aggregator displays 40 search results by default.
Aggregators have an internal limit of 500K results by default. A single aggregator does not forward more than 500K results to subsequent aggregators or process commands. Use the limit <number> command to set a higher limit of results to forward.
Queries using an aggregator that results in large groupings can result in incomplete search results. To get complete results, use the order by to sort the search results in ascending or descending order. There are also audit logs that you can use to check or confirm the results.
Using free text queries within an aggregator results in raw log processing, a resource heavy operation. Only use free text within an aggregator when absolutely necessary.
With chart command, you get log messages in a chart form. To see all the messages containing login and group them by device_ip, use the following query.
login device_ip = * | chart count() by device_ip
This query searches for all the log messages containing the word login, and groups them by device_ip. It then displays the number of log messages for each device_ip.
You can also count by multiple fields. The log message count is then displayed for each field.
login | chart count() by destination_address, destination_port
In this case, the count of the log messages for every combination of destination_address and destination_port is grouped and the corresponding count is shown.
You can use other aggregation functions such as max and min in place of count.
connection | chart max(datasize) by source_address
datasize=*| chart max(datasize) as mx, min(datasize) as mn,
sum(datasize) as sm by source_address limit 15
You can also display the chart in different forms such as Column, Bar, Line and Area.
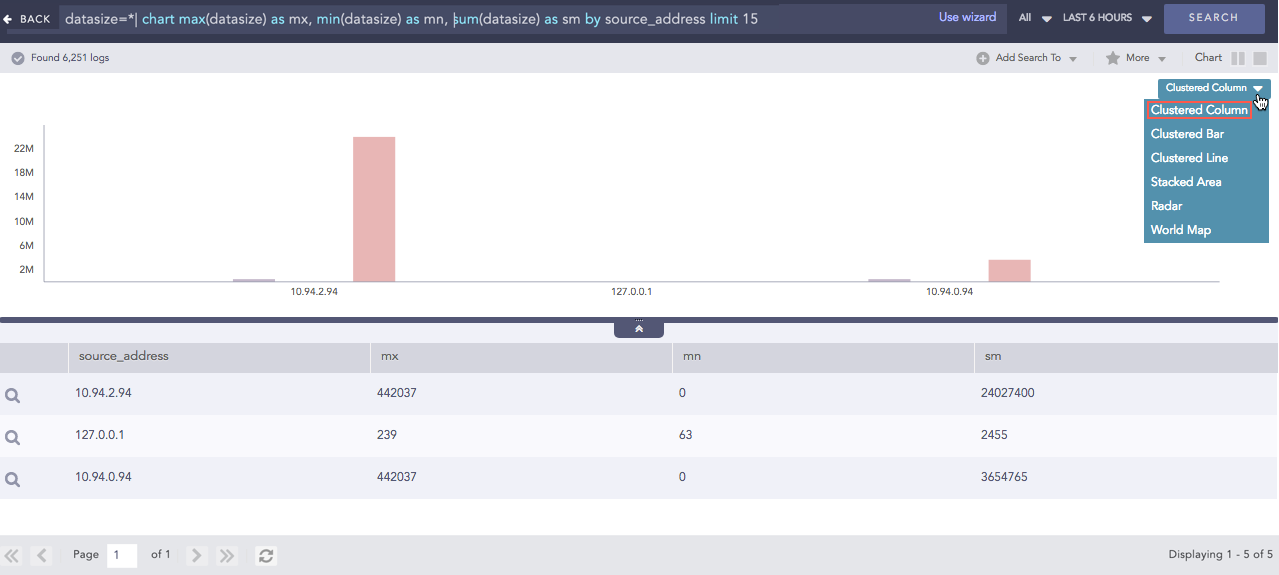
Column Chart
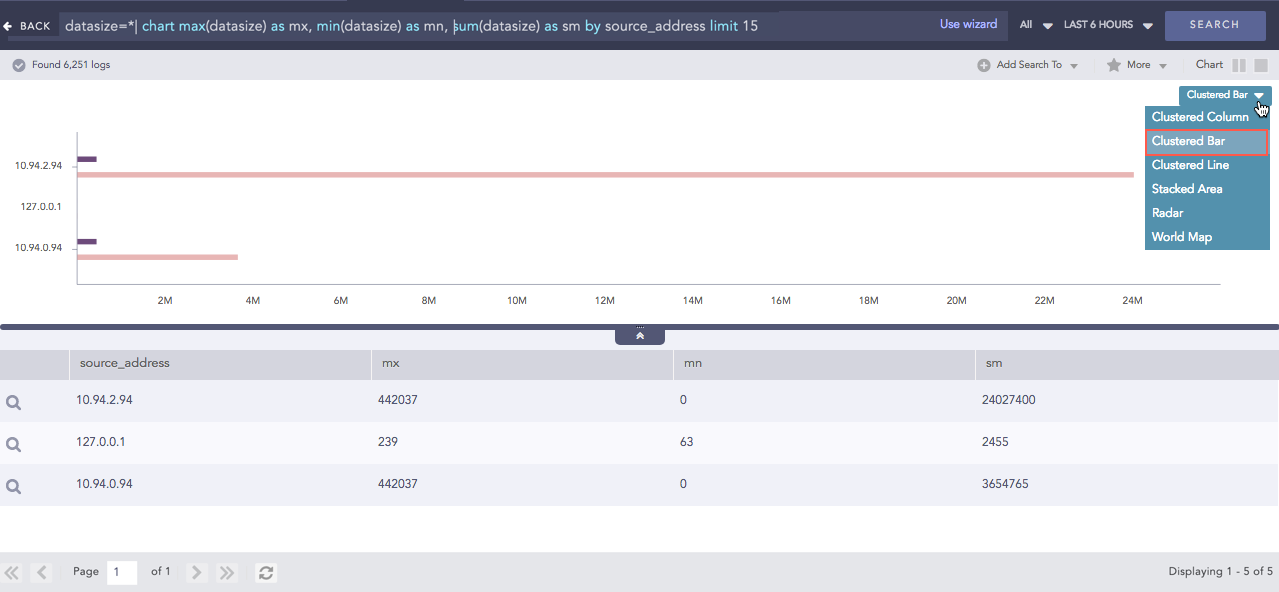
Bar Chart

Line Chart
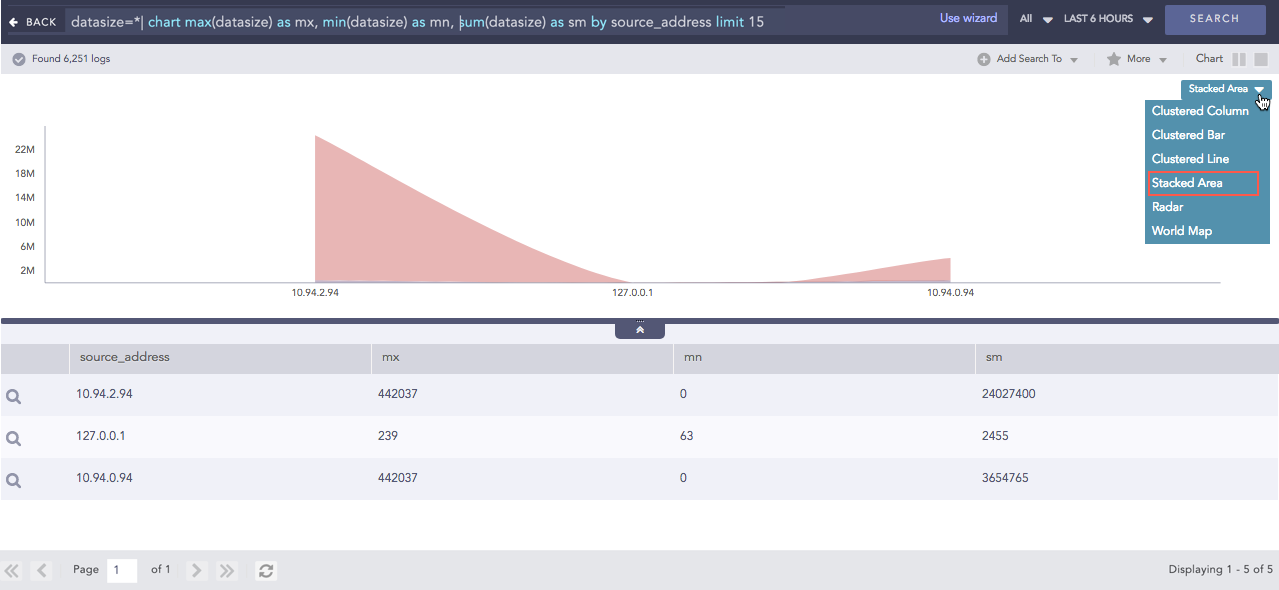
Area Chart
You can also modify aggregation functions as follows:
object = connection | chart count(action=permitted) by source_address
In this query, only the log messages containing action=permitted are counted. You can write the same query as:
action = permitted object = connection | chart count() by source_address
Multiple counts or other aggregators can be used in a single query string.
object = connection | chart count(action=permitted), count(action=blocked)
by source_address
This query displays two columns. The first is the count of the connections with the permitted action and the second is the count of blocked actions.
You can use order by to sort the search results within a single query, without spearating it with a pipe (|).
device_name=* | chart count() by email, log_ts order by log_ts asc
You can use timechart to chart log messages as a time series data. It first displays logs according to the time they were collected or generated. Then, it returns the log results according to the collection time stamp (col_ts) or log generation time (log_ts). You cannot use order by with timechart.
The terms log_ts and col_ts have different functions.
log_ts |
col_ts |
|---|---|
Denotes the time present in log messages. |
Denotes the time when Logpoint collected the log. |
For example you can timechart all the messages with login shown below.
login | timechart count()
This plots the count of all the messages containing the word login into a graph with the horizontal axis as time. The total time-span is the time selected for the search query.
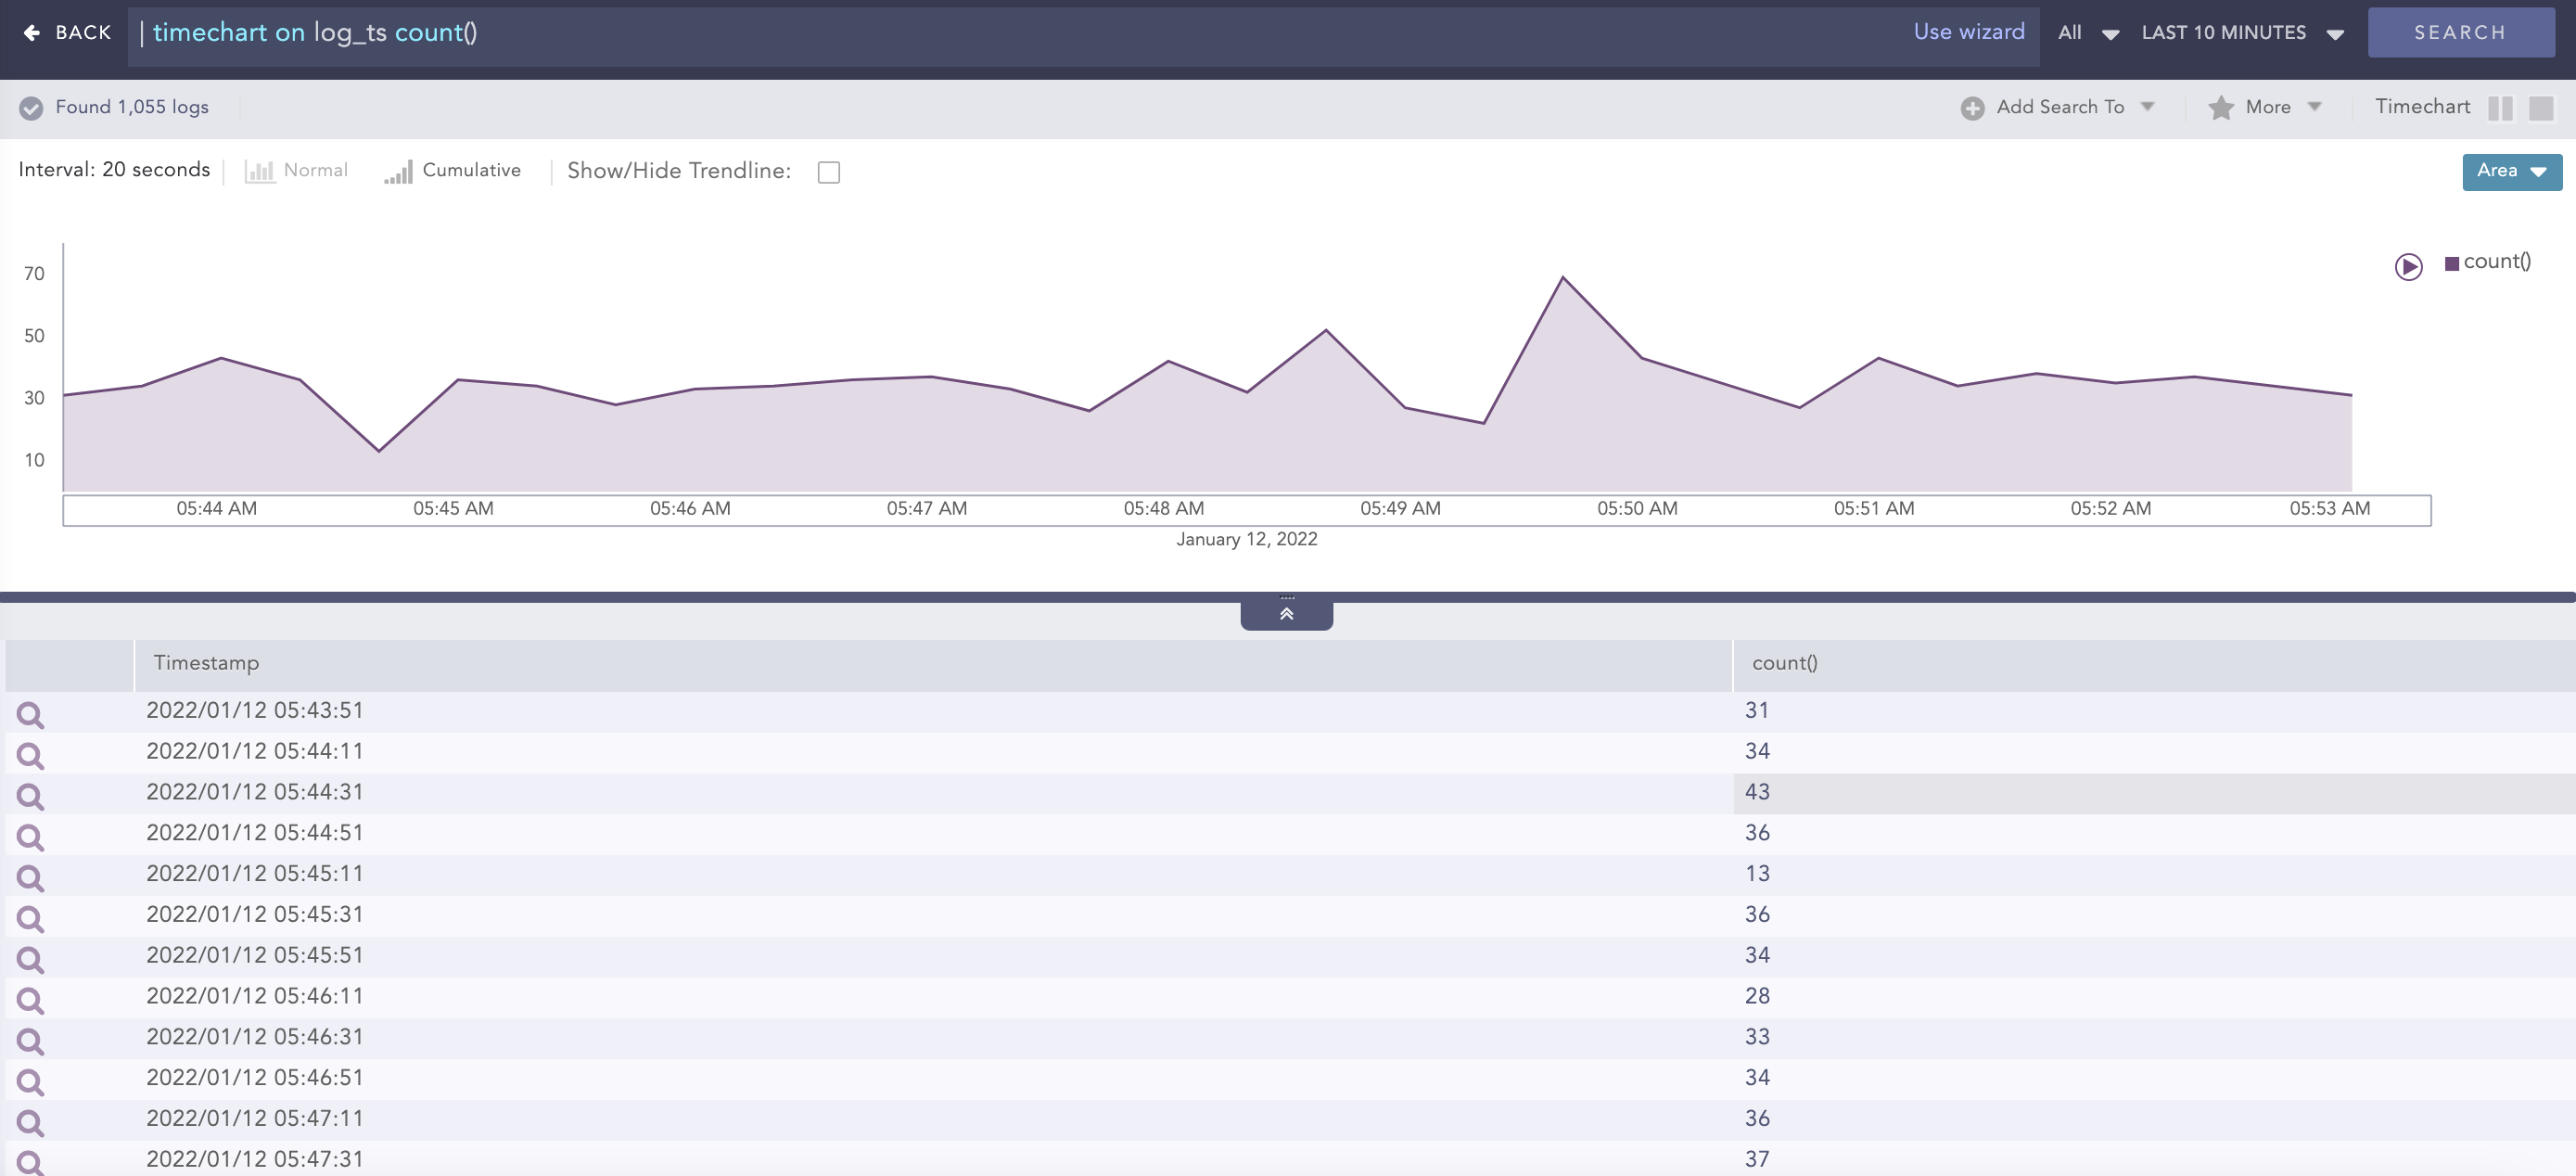
| timechart on log_ts count()
This query plots the count of the logs based on the log_ts field.
You can also use the timechart command to plot the data on a fixed time-interval. To have a timechart with bars for every 20 minutes, use the following query:
login | timechart count() every 20 minutes
You can use every x minutes, every x hours, or every x days with the timechart.
Note
When the limit of timechart() is not specified, the number of bars of the timechart depends on the nature of the query.
The number is always equal to 30 if the time-range is less than 30 units. For example, if you provide a time range of 10 minutes Logpoint displays 30 bars in the span of 20 seconds.
If the time-range is greater than 30 units, the number of bars is equal to the time-range. This holds true until the upper limit of the number of bars is reached, which is 59.
There are also some special cases for the number of graphs. The number of bars is equal to the number of seconds specified and the time span of 1 day displays 24 bars in the span of one hour.
Aggregators are used with the chart and the timechart commands by joining them with the | symbol.
Note
The aggregators are pluggable from Logpoint 5.2.4. This means Logpoint can create such functions on request.
You can use avg() to calculate the average of all the values of the specified field.
Example:
| chart count(), avg(response_time, response_time=*)
This query calculates the average response_time.
You can use count to get the total number of logs in the search results.
Example:
| chart count()
This query displays the total number of log messages in the search results.
login | chart count() by device_ip
This query searches for all the log messages containing the word login. It then groups the logs by their device_ips and shows the count of the log messages for each of the Device IP.
You can also give filters to the count() as shown below.
login | chart count(event_id = 528) by device_ip
This query looks for all the log messages containing the word login. It then groups them by their device_ip s and shows the count of the messages containing the field value event_id = 528.
You can use dictinct_count() to get the number of unique values in a list or dataset. It is used to know how many unique elements there are in a particular set of data. If you have a list of users, the distinct count would tell you how many unique users there are, regardless of how many times each user appears in the list.
It can be used to identify unique unauthorized access attempts, activities associated with those attempts and the measures taken to prevent those attempts and activities.
For example, a sudden increase in the number of unique source-destination IP connections between uncommon IP addresses might indicate potential security threats or unauthorized network activities. Example:
| chart distinct_count(Source_destination)
In this case, distinct_count() returns the count of the distinct Source_destination regardless of the number of times it appears in the list.
If the search results for Source_destination has the following data:
Source_destination |
Target_destination |
|---|---|
10.145.6.78 |
14.48.7.58 |
25.7.32.16 |
14.48.7.58 |
25.7.32.16 |
15.6.7.89 |
90.56.2.156 |
14.48.7.58 |
10.145.6.78 |
15.6.7.89 |
The result for the distinct_count() for Source_destination is 3.
Note
If there are large numbers of unique values in the data, search results can be slow.
You can use distinct_list() to return the list of all the distinct values of the field.
Example:
To view all the distinct values of the field action in the system, you can use the following query:
| chart distinct_list(action)
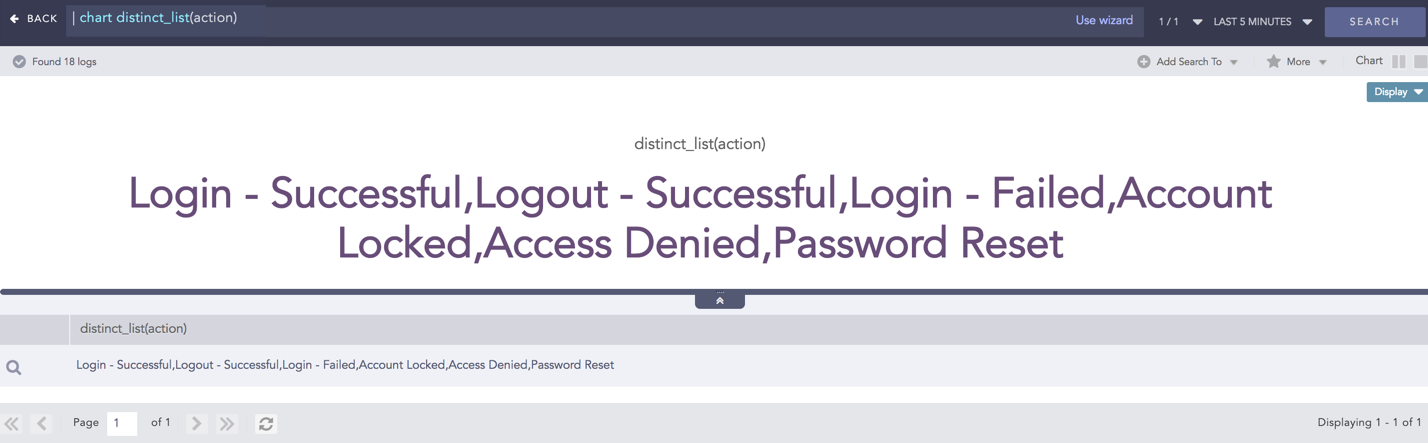
Example of distinct_list
You can use a grouping parameter to group the distinct list.
Example:
| chart distinct_list(action) as actions by user
This query returns the list of every distinct value of the action field in the actions column grouped by the grouping parameter user. You can use this example to view all the actions performed and machines used by every user in your system.
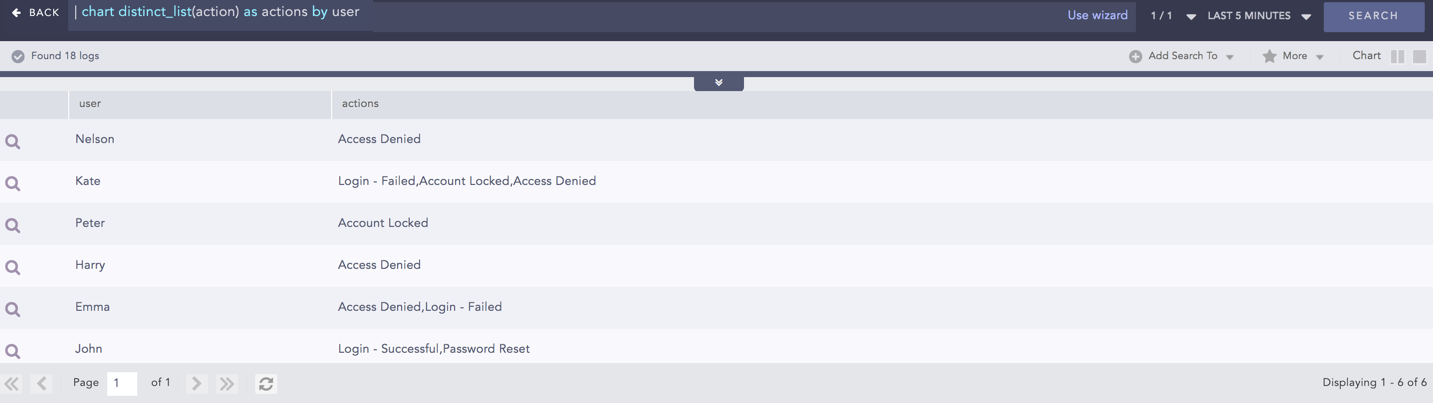
Example of distinct_list
You can also use this aggregators with other aggregation commands.
Example:
user=Jolly | chart distinct_list(action) as actions, distinct_count(action) as actions_count by user
This query returns the list of all the distinct actions with their counts for the user Jolly.
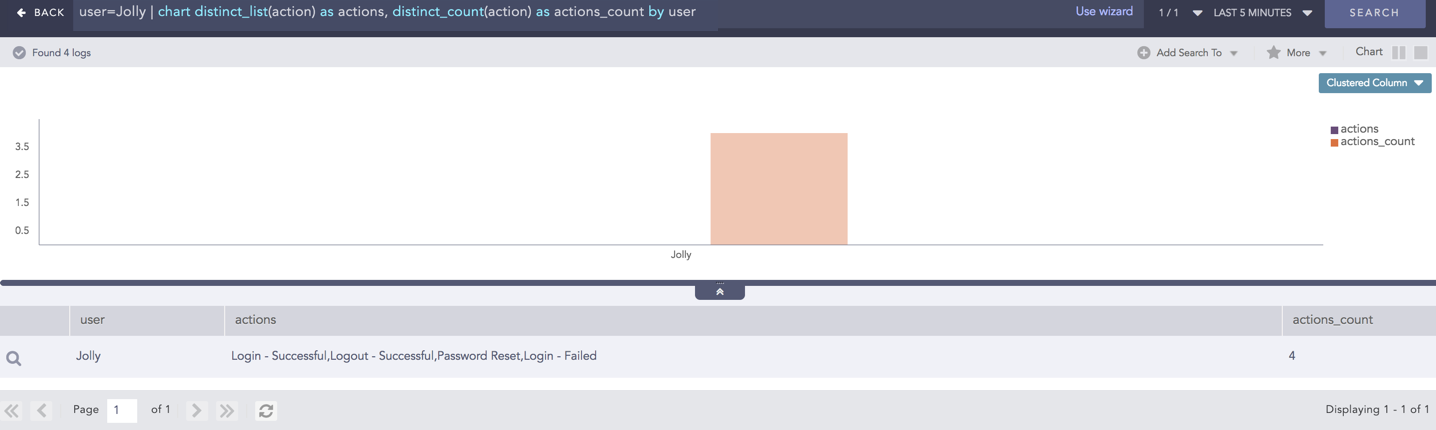
Example of distinct_list
list() takes a field as a parameter and returns the field values as a list in the search result. The duplicate field values are also included in the list.
Syntax:
| chart list (field name) as string
| timechart list (field name) as string
Example:
| chart list (actual_mps) as number
.png)
Example of list
This query gives the list of the actual_mps field values and returns the list in the number field.
Example:
| chart list (action) as actions by user
1.png)
Example of list with grouping parameter
This query gives the list of the action field values grouped by user grouping parameter and returns the list in the actions field.
These aggregators can be used to find the maximum or minimum value of the specified field.
Example:
| chart max(severity) by device_ip
This query displays the maximum severity value in each of the device_ip.
Example:
login | chart count(), max(col_ts) by device_ip, col_type
This query looks for all the log messages containing the word login. Then, it groups the search results by their device_ips and the col_type and shows the count of the log messages and the latest col_ts for each of the groups.
The max() and min() also support filter expressions as:
| chart max(severity, severity < 5)
This query shows the maximum severity that is less than 5.
You can use the sum() to sum the values of the specified fields.
Example:
| chart sum(datasize) by device_ip
This query displays the sum of all the datasize fields for each device_ip.
You can also give filters to the sum() function.
Example:
| chart sum(datasize, datasize > 500)
This query only sums a datasize if it is greater than 500. The expression can be any valid query string but must not contain any view modifiers.
You can use var() to calculate the variance of the field values. Variance describes how far the values are spread out from the mean value.
Execute the following query to visualize how the data fluctuates around the average value.
severity = * | chart count(),avg(severity),var(severity) by device_ip
Note
You can use +, -, *, /, and ^ to add, subtract, multiply, divide, and to raise the power in the min(), max(), sum(), avg(), and var() functions.
Example:
avg(field1/field2^2+field3)
Warning
When using avg(), and min(), it is good to use a filter to discard log messages not containing the specified fields.